 Sol-Earth Dashboard
 Latest Situation Summary
--Loading summary...
NOAA Headline Alerts
Current Space Weather Status
-Next Impact Prediction
NOAA SWPC Solar Images & Videos
Select an image from the sidebar to preview
SOHO & HMI Images & Videos
Select an image from the sidebar to preview
Timeline Comparison
This chart compares four geophysical metrics over time to explore potential correlations between solar activity (Kp Index, solar flares) and seismic activity (earthquake magnitude). Each metric uses its own scale shown on the Y-axes.
Recent Solar Events (Flares, CMEs)
Recent Earthquakes
Earthquake Map
Comet 3I/Atlas (Interstellar Visitor)
Visible Comets
Solar Activity vs Magnitude
Kp Index vs Magnitude
Kp Index measures geomagnetic activity on a scale from 0 (quiet) to 9 (extreme storm)
Solar Wind Speed vs Magnitude
Solar wind speed is measured in km/s, typically ranging from 300-1000 km/s
Understanding These Charts
What you're seeing: These charts show correlations between solar activity and earthquake magnitude. Each chart displays a separate relationship:
- Kp Index vs Magnitude: Shows the relationship between geomagnetic activity (Kp Index, scale 0-9) and earthquake magnitude. The Kp Index measures geomagnetic storm intensity, with higher values indicating stronger geomagnetic disturbances.
- Solar Wind Speed vs Magnitude: Shows the relationship between solar wind speed (typically 300-1000 km/s) and earthquake magnitude. Solar wind speed is measured in kilometers per second and represents the velocity of particles streaming from the Sun.
How to interpret: Each point represents an earthquake at a specific magnitude (Y-axis) that occurred during a period with specific solar activity (X-axis). The patterns in these charts may reveal correlations between solar activity and seismic events.
Sun-Facing Analysis
Correlation Heat Map
Understanding the Correlation Heat Map
What you're seeing: This heatmap visualizes the correlation between Kp Index (geomagnetic activity) and earthquake magnitude. The chart shows how frequently earthquakes of different magnitudes occur during periods of varying geomagnetic activity.
- X-axis (Kp Index): Measures geomagnetic activity on a scale from 0 (quiet) to 9 (extreme storm). Higher values indicate stronger geomagnetic disturbances caused by solar activity.
- Y-axis (Earthquake Magnitude): The Richter scale magnitude of earthquakes, typically ranging from 2.5 to 5.5+ in this dataset.
- Visualization: The size/intensity of each point represents the frequency of earthquakes occurring at that specific combination of Kp Index and magnitude. Larger or more intense areas indicate more frequent correlations.
How to interpret: Patterns in this heatmap may reveal relationships between geomagnetic activity and seismic events. Clusters of high frequency suggest potential correlations between solar activity and earthquake occurrence at specific magnitude levels.
SWPC Products & Animations
Planetary K-Index
Geomagnetic Storm Archive
Historical Storm Events
| Date/Time | Storm Level | Peak Kp | Duration | Associated Events | Actions |
|---|---|---|---|---|---|
| Loading storm events... | |||||
Schumann Resonance
Schumann Resonances 0-40 Hz (Ez) Spectrogram UTC+7
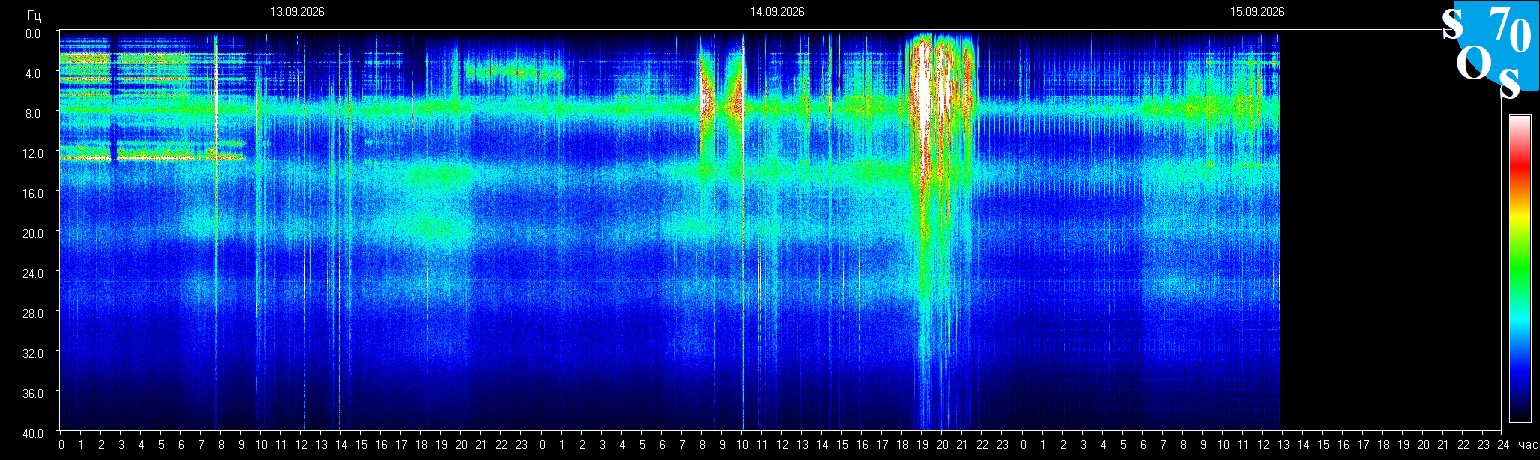
Schumann resonances are extremely-low-frequency vibrations in the 0-50 Hz range. This data shows the vertical electric field (Ez) from 0-40 Hz as measured by a T-antenna. It is sensitive to wind vibrations and local atmospheric electrification. Therefore this spectrogram cannot be used exclusively for global observation, local atmospheric effects must be identified as well as microphonic noise from wind-induced vibrations.
Data Source: Schumann resonances data is provided by the Space Observing System located in Tomsk, Russia (UTC+7).
About Schumann Resonances
The Sun Daily
Loading daily synoptic video...
Sun Perspectives
Loading solar perspectives...
Local Weather
Loading weather data...
Meteor Showers
Loading meteor shower data...
Live Satellite Eyes
Hubble Space Telescope
What is Hubble observing now?
Loading Hubble view...
Webb Space Telescope
What is Webb observing now?
Loading Webb view...
About Live Telescope Views
These views show what the Hubble and Webb Space Telescopes are currently observing in real-time. The telescopes are operated by NASA and ESA, providing unprecedented views of the universe.
- Launched in 1990
- Visible, ultraviolet, and near-infrared observations
- Over 1.5 million observations to date
- Launched in 2021
- Infrared observations of distant galaxies
- Successor to Hubble with enhanced capabilities